
The camera still decides the smartphone. Which brand leads in camera quality in India, by price segment?
The camera remains the feature Indian smartphone buyers talk about most. Across 171,324 users of 301 smartphone models, 17.7% mention the camera unprompted. Only price and value (19.2%) come up more often, and price is a purchase factor rather than a device feature.
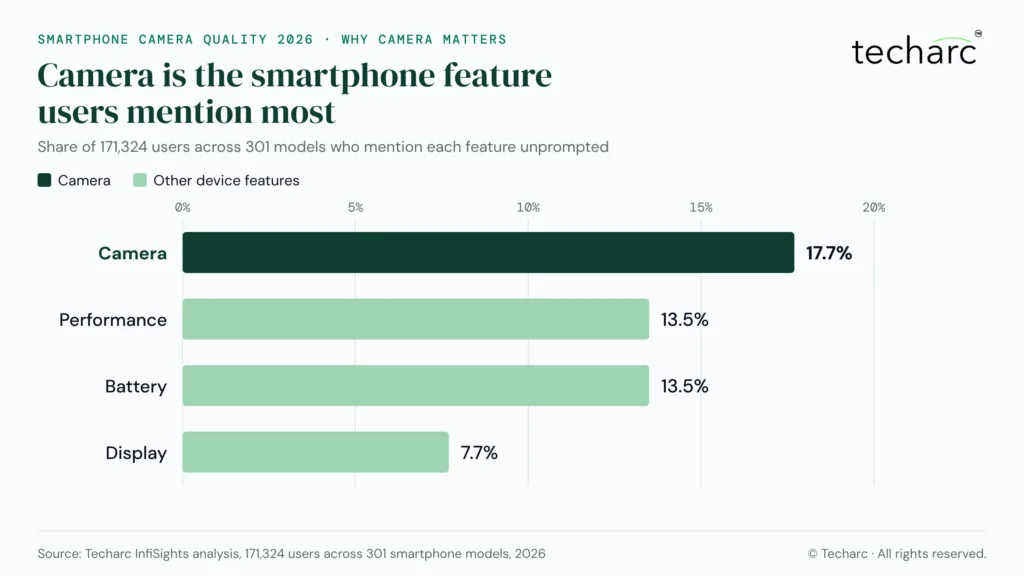
FIGURE 01 Share of users mentioning each smartphone feature unprompted. Source: Techarc InfiSights analysis, 171,324 users across 301 models, 2026.
Camera experience now means video as well as photos. Photos still dominate: they account for roughly two in three camera mentions in reviews, and video for about one in three. Buyers record, share and post video often enough that a phone’s camera is judged on both, which is why this study scores photography and videography separately and gives them equal weight in the total.
Industry insights
Camera leadership in India is decided price tier by price tier; no brand leads across the whole market. Techarc scored 18 brands in eight price segments, and three different brands lead at least one segment outright.
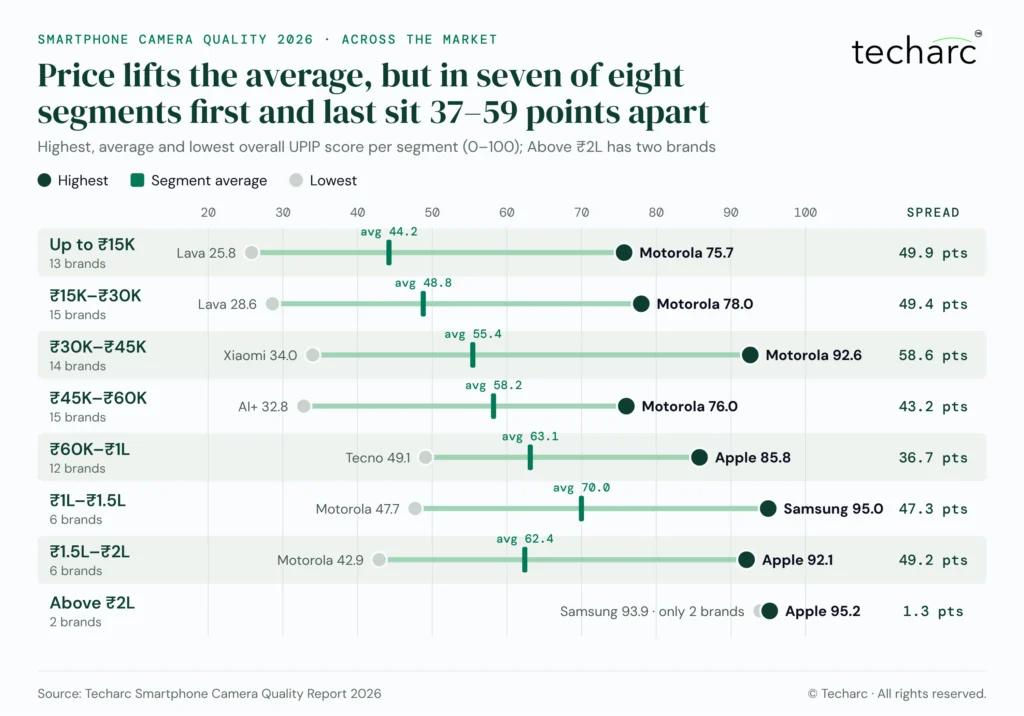
FIGURE 02 Highest, average and lowest overall UPIP score in each price segment.
Across the market
- Price lifts the floor, not the ranking. The average segment score rises from 44.2 under ₹15K to 70.0 in ₹1L–₹1.5L. Yet in every segment with more than two brands, first and last place sit 37–59 points apart, so tuning separates brands as much as hardware. Example: In ₹15K–₹30K, Motorola scores 78.0 and Lava 28.6, a 49.4-point gap between phones at the same price.
- The mass market has a clear benchmark; the top end is a close race. Leads below ₹45K run 13.5–23.3 points. Above ₹1L, two of three segments are decided by under 3 points. Example: Motorola leads Up to ₹15K by 23.3 points, while Samsung leads ₹1L–₹1.5L by just 2.9 points over Apple.
- Photo and video leadership often diverge. In three of eight segments (₹45K–₹60K, ₹1L–₹1.5L and Above ₹2L), different brands lead photography and videography. Example: In ₹45K–₹60K, Apple leads photography (81.6) and Vivo leads videography (76.3), while Motorola leads overall.
- Colour is the industry’s common weakness in the mid-market. Colour fidelity is the weakest video attribute across brands from ₹15K to ₹60K, and colour accuracy the weakest photo attribute from ₹30K to ₹1L. Example: Motorola stands out against this gap, leading colour accuracy and colour fidelity in all four segments below ₹60K; in ₹30K–₹45K it scores 100 on colour accuracy against a segment average of 51.2.
- Low light and stabilisation hold back the upper tiers. In ₹1L–₹2L, low-light photography is the weakest photo attribute and stabilisation the weakest video attribute on average. Example: Apple is the exception, leading both low-light photography and stabilisation in ₹1L–₹1.5L and ₹1.5L–₹2L with 97.0 on each.
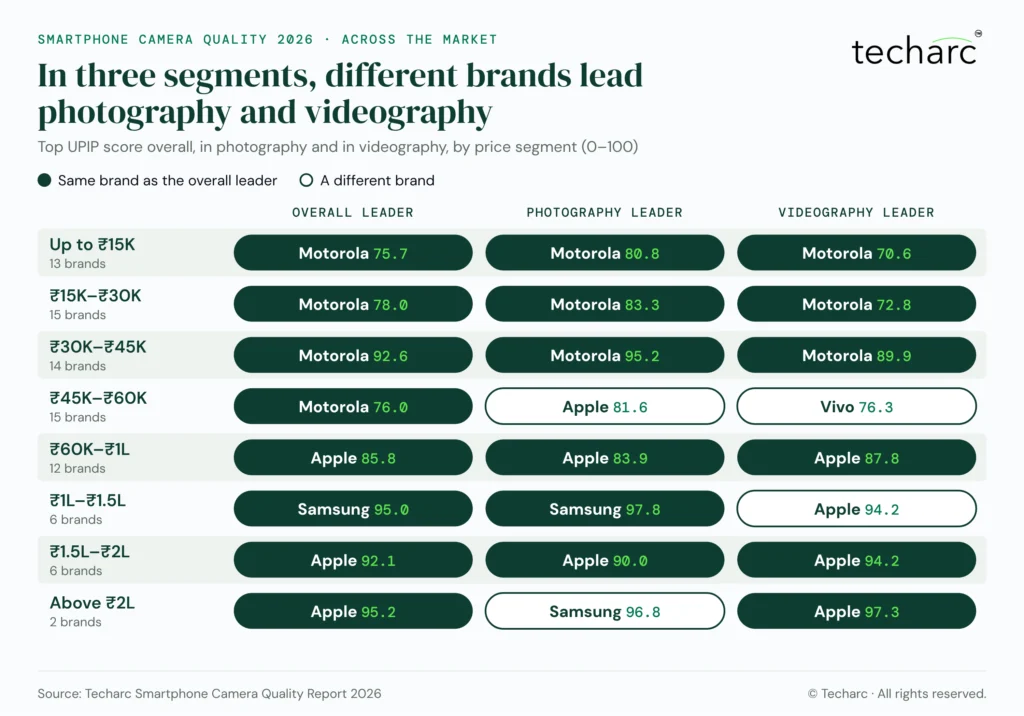
FIGURE 03 Overall, photography and videography leaders by price segment.
Segment by segment
Scores are 0–100 and comparable only within a segment.
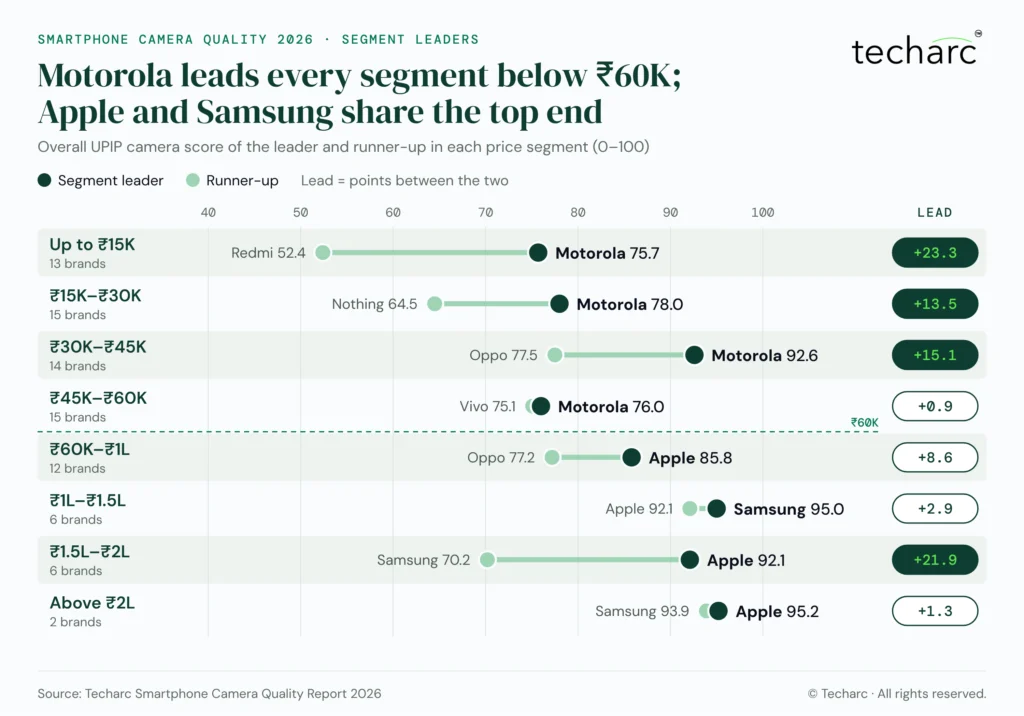
FIGURE 04 Overall leader and runner-up in each price segment, with the size of the lead.
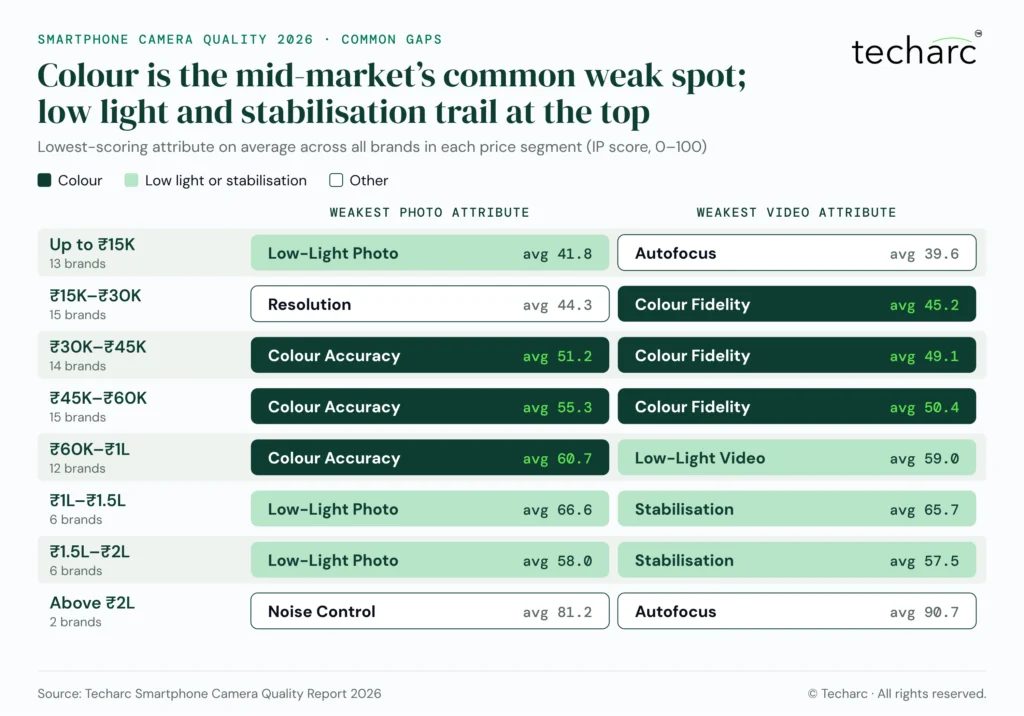
FIGURE 05 Weakest photo and video attribute on average across all brands in each price segment.
- Under ₹30K: Motorola leads by double digits; the rest of the field clusters between 25 and 65. Low-light photos, autofocus and resolution are the common gaps.
- ₹30K–₹60K: The most crowded band, with 14–15 brands each. Motorola leads both segments, but ₹45K–₹60K is the tightest overall race in the study (0.9 points).
- ₹60K–₹1L: Apple leads photo, video and overall; Oppo is 8.6 points behind.
- ₹1L and above: A two-brand contest between Apple and Samsung in a field of six or fewer, where scores run highest and gaps narrowest.
Brand-level findings
Each brand’s camera standing changes with price: most brands are strongest in one band and fall back in others. Brands are listed alphabetically; ranks are within each price segment.
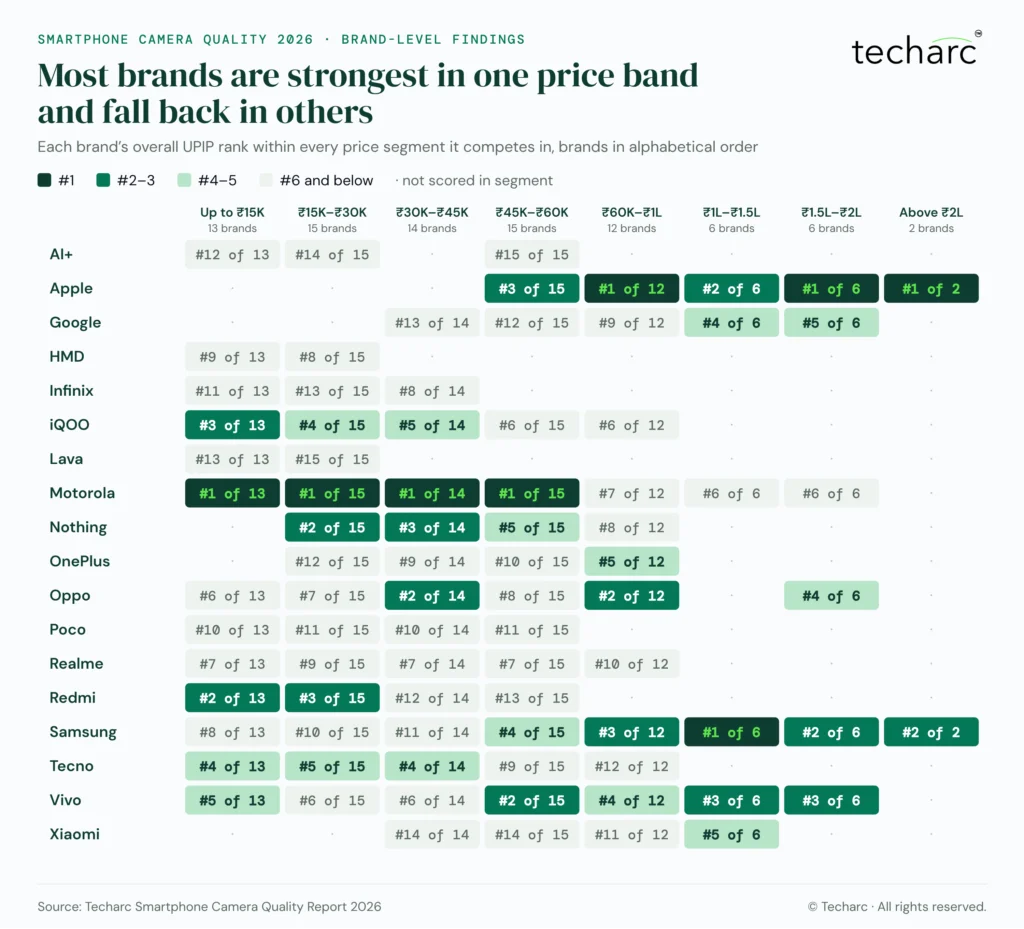
FIGURE 06 Each brand’s overall UPIP rank in every price segment it competes in.
- AI+ — Scored in three segments (Up to ₹15K, ₹15K–₹30K and ₹45K–₹60K) and ranks in the bottom three in each. Resolution and dynamic range are its relative strengths; colour accuracy and stabilisation are its growth areas.
- Apple — Scored in five segments from ₹45K upward. It leads ₹60K–₹1L (85.8), ₹1.5L–₹2L (92.1) and Above ₹2L (95.2), is 2nd in ₹1L–₹1.5L (92.1) and 3rd in ₹45K–₹60K, where it leads photography (81.6). It leads low-light photography and resolution in every segment it competes in.
- Google — Scored in five segments from ₹30K to ₹2L. Its best rank is 4th of 6 in ₹1L–₹1.5L (60.5); it sits in the lower half elsewhere. Resolution and colour fidelity are strengths; stabilisation and low-light photography trail.
- HMD — Scored in the two segments up to ₹30K, ranking 9th of 13 and 8th of 15. Colour accuracy and dynamic range lead its profile; noise control and autofocus trail.
- Infinix — Scored in three segments up to ₹45K. Its best rank is 8th of 14 in ₹30K–₹45K (52.3); it is 11th and 13th in the two lower segments.
- iQOO — Scored in five segments up to ₹1L. It finishes in the top five in all three segments below ₹45K (3rd, 4th and 5th) and 6th in the two above. Colour fidelity and resolution are its strengths.
- Lava — Scored in the two segments up to ₹30K and ranks last in both.
- Motorola — Scored in seven segments up to ₹2L. It leads all four segments below ₹60K (75.7, 78.0, 92.6 and 76.0), leading photography and videography in three of them. It ranks 7th of 12 in ₹60K–₹1L and 6th of 6 in ₹1L–₹1.5L and ₹1.5L–₹2L.
- Nothing — Scored in four segments from ₹15K to ₹1L. It is 2nd in ₹15K–₹30K (64.5), 3rd in ₹30K–₹45K (76.2), 5th in ₹45K–₹60K and 8th in ₹60K–₹1L. Low-light photography and noise control are strengths.
- OnePlus — Scored in four segments from ₹15K to ₹1L, and climbs with price: from 12th of 15 in ₹15K–₹30K to 5th of 12 in ₹60K–₹1L (62.9).
- Oppo — Scored in six segments. It is 2nd in ₹30K–₹45K (77.5) and ₹60K–₹1L (77.2), and leads photo dynamic range in three segments.
- Poco — Scored in four segments up to ₹60K, ranking 10th or 11th in each. Low-light video and dynamic range are its strengths.
- Realme — Scored in five segments up to ₹1L, ranking 7th to 10th. Stabilisation and dynamic range are strengths; colour accuracy and noise control trail.
- Redmi — Scored in four segments up to ₹60K. It is 2nd under ₹15K (52.4) and 3rd in ₹15K–₹30K (55.2), but 12th and 13th in the ₹30K–₹60K band.
- Samsung — The only brand scored in all eight segments. It leads ₹1L–₹1.5L (95.0), is 2nd in ₹1.5L–₹2L and Above ₹2L, where it leads photography (96.8), and 3rd and 4th in ₹60K–₹1L and ₹45K–₹60K. It ranks 8th to 11th below ₹45K.
- Tecno — Scored in five segments up to ₹1L. It ranks 4th or 5th in the three segments below ₹45K and leads video stabilisation in all four segments below ₹60K, but is last of 12 in ₹60K–₹1L.
- Vivo — Scored in seven segments up to ₹2L. It is 2nd in ₹45K–₹60K (75.1), 0.9 points off the lead, and leads in videography there (76.3). It ranks 3rd in ₹1L–₹1.5L and ₹1.5L–₹2L, and 4th in ₹60K–₹1L.
- Xiaomi — Scored in four segments from ₹30K to ₹1.5L. It is last in ₹30K–₹45K, 14th in ₹45K–₹60K and 5th of 6 in ₹1L–₹1.5L. Noise control and low-light photography are its strengths.
Implications
Camera quality is a price-tier contest, and the mass market now has a clear benchmark to beat.
- Customers: The best camera at a given budget is often not from the brand that leads the flagship tier. Below ₹60,000, the strongest scores come from Motorola, Nothing, Oppo, Redmi and Vivo rather than Apple or Samsung.
- OEMs: Colour is the most common weakness from ₹15K to ₹1L, making colour tuning the most direct route to a higher segment rank. Motorola has an edge here with its Pantone Validated cameras, and it leads both colour accuracy and colour fidelity in every segment below ₹60K. With video now a third of camera talk, video colour and stabilisation matter as much as photo resolution.
- Upper-tier OEMs: Low-light photography and video stabilisation are where ₹1L–₹2L devices trail on average, and where customers trading up expect visible gains.
- Retail and channel partners: Segment-level camera leaders give store staff a price-specific, evidence-based talking point instead of a single brand ranking.
- Component and imaging suppliers: The ₹15K–₹60K band, where ranks are decided by tuning more than hardware, is likely where colour-science and ISP tuning support will be most in demand.
Brands likely to gain
- Apple — Leads three of the four segments above ₹60K, including the widest upper-tier margin (21.9 points in ₹1.5L–₹2L).
- Motorola — The only brand to lead four segments; well placed to build a camera-led message for the mass market.
- Oppo — Runner-up in two segments either side of ₹60K, with consistent dynamic-range strength.
- Vivo — Within 0.9 points of the lead in ₹45K–₹60K and the videography leader there; the closest challenger in that segment.
Methodology
Scores use Techarc’s UPIP framework, which blends Image Processing (IP) and User Perception (UP), and compare each brand only with others in its price segment.
- Training the IP algorithms: Techarc’s Image Processing (IP) algorithms were first trained on a repository of more than 10,000 photo and video samples, captured by the Techarc team over the years on different smartphone cameras in different conditions.
- Data collection: For this study, photos and videos were crowd-sourced from users of the 300+ smartphone models covered, across 18 brands and eight price segments from up to ₹15K to above ₹2L.
- Image Processing (IP): The crowd-sourced samples were analysed by the IP algorithms already trained on Techarc’s own photos and videos. They measure ten attributes: low-light photo, noise control, dynamic range, colour accuracy and resolution for photography; autofocus, low-light video, dynamic range, colour fidelity and stabilisation for videography.
- User Perception (UP): Reviews from users of each model, sentiment-analysed on photo, video, overall camera and low-light performance.
- Normalisation: IP and UP measures are scaled 0–100 brand-vs-brand within each price segment; noise is inverted so lower noise scores higher.
- Score computation: IP and UP are blended into a Photo score and a Video score; the Total score averages the two.
Segment-wise scoring keeps flagship hardware from inflating a brand’s standing: a score shows a brand’s position among its price-segment peers, not an absolute camera rating, and scores are not comparable across segments. The ₹1L–₹1.5L and ₹1.5L–₹2L segments have six brands each, and Above ₹2L has two, so rankings there rest on a smaller field. Review-mention figures come from Techarc’s InfiSights analysis of 171,324 users across 301 models.
What the full report adds
This note names the leaders; the full report shows the whole field, segment by segment and brand by brand.
- The top five in every segment, three ways. See who ranks in the top five overall, in photography and in videography in each of the eight price segments, not just who comes first.
- The leader of every attribute. Which brand has the best autofocus at ₹60K–₹1L? Which has the best low-light video under ₹15K? The report names the leader of all ten photo and video attributes in every segment.
- A camera profile for all 18 brands. Photo, video, and total scores; rankings in every segment each brand competes in; a ten-attribute breakdown; and each brand’s typical strengths and growth areas.
- Where points are won and lost. Attribute-level scores show which capabilities lift a brand to the top of its segment, and which hold it back.
- The UPIP method in full. The scoring architecture, study process and data sourcing behind every number.
Download the report
Important Notice: Usage and Citation Rights
This report is publicly accessible for reading only. No brand, OEM or company, and no agency, partner or other party acting on its behalf, may cite, quote, reproduce or reference this report or any of its data, findings or charts, whether internally or externally, without prior written permission from Techarc that expressly grants citation and usage rights. This includes use in media communications, partner or channel materials, advertising, presentations and social media. To request permission, write to info@techarc.net.