India Logged 257 Smart Devices in Q2 2026 as Variant Fan-Out and Expensive Launches Reshape the Market
Thursday, 16 Jul 2026
India Smart Consumer Electronics Launch Analysis – Q2 2026 This report consolidates every new product launch Techarc tracked across four categories in the Indian market during Q2 2026 (April–June): Smartphones, Laptops, Smart TVs and Tablets. Across all four trackers, 257 total launch entries, unique models plus their variants, were logged in Q2, led by Smart […]
India Smart Consumer Electronics Launch Analysis – Q2 2026
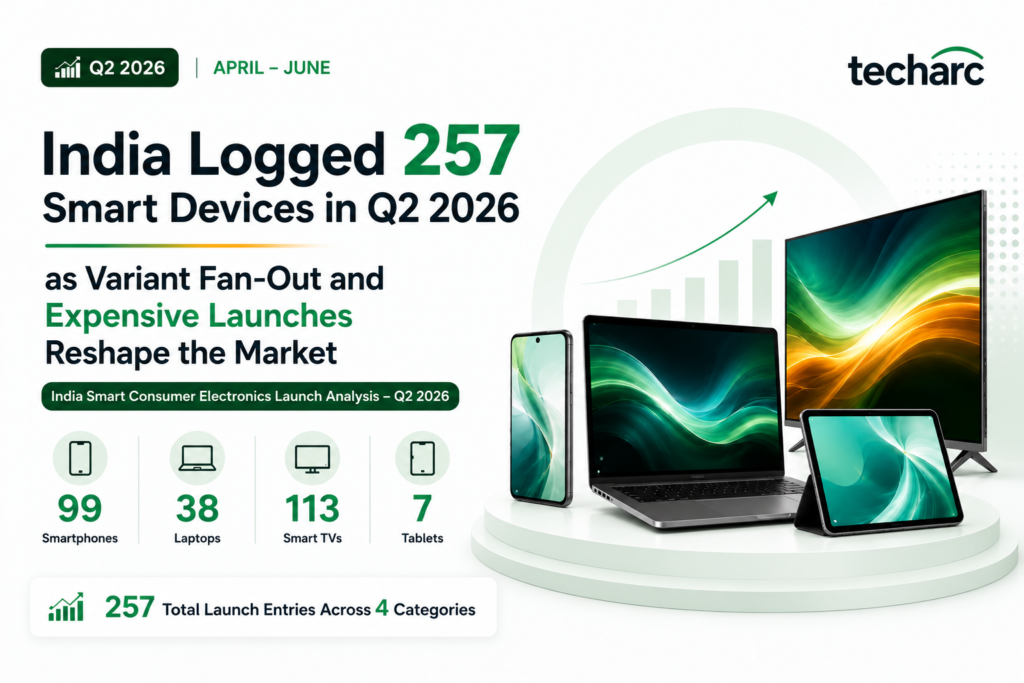
This report consolidates every new product launch Techarc tracked across four categories in the Indian market during Q2 2026 (April–June): Smartphones, Laptops, Smart TVs and Tablets. Across all four trackers, 257 total launch entries, unique models plus their variants, were logged in Q2, led by Smart TVs (113) and Smartphones (99).
Cross-Category Themes
Variant proliferation differs sharply by category. Smartphones and Smart TVs show heavy variant fan-out, RAM/storage configs for phones, screen-size configs for TVs, while Laptops and Tablets stay closer to one SKU per model.
Higher-value launches co-exist with mass-market offerings across categories, creating a barbell-shaped launch mix spanning accessible and premium price bands.
AI and connectivity features have crossed from differentiator to baseline. 5G, Copilot+ PCs, large batteries and high refresh-rate panels are now standard in Smartphones and Laptops.
Make in India coverage is near-total for Smartphones (99%) and Smart TVs (95.6%), but meaningfully lower for Laptops (63.2%), which still relies more on imported units.
Brand concentration risk is visible everywhere: Realme in Smartphones, Asus in Laptops, Samsung in Smart TVs, and OnePlus/Moto in Tablets each account for an outsized share of launch activity.
Tablets saw a very thin Q2 (7 launches vs. 18 in March alone). This is a seasonality effect, not a demand signal, and should be read with that caveat.
Of the 99 total Q2 entries, 53 represent distinct model launches; the remaining 46 rows are RAM/storage variants of an already-launched model (e.g. a 128 GB and a 256 GB configuration of the same phone). On average, each unique smartphone model shipped in ~1.9 configurations this quarter — a sign that brands are using variant depth, not just new models, to cover more price points per launch.
22 models launched in exactly 2 configurations, 12 models in 3 configurations, and 19 models in a single configuration only.
Variant-heavy launches (3 configs) included models from iQOO, Realme, Vivo, Redmi and Ai+ — typically spanning a base, mid and top RAM/storage tier.
1.2 Month-wise Launch Trend
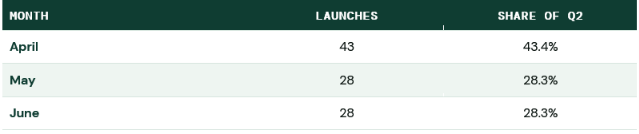
April was the busiest launch month, nearly matching May and June combined in some weeks, typically driven by pre-summer and new-model-year refreshes.
1.3 Segment-wise Launches
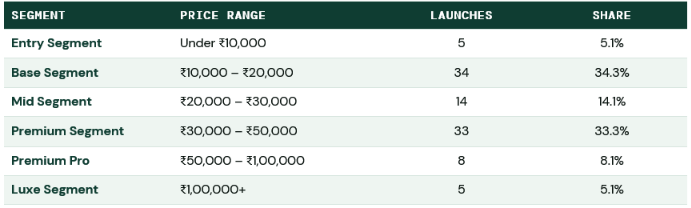
The market is bimodal: Base and Premium segments together account for two-thirds of Q2 launches, while the true entry (<₹10k) and luxe (₹1L+) tiers remain niche.
1.4 Brand-wise Bifurcation
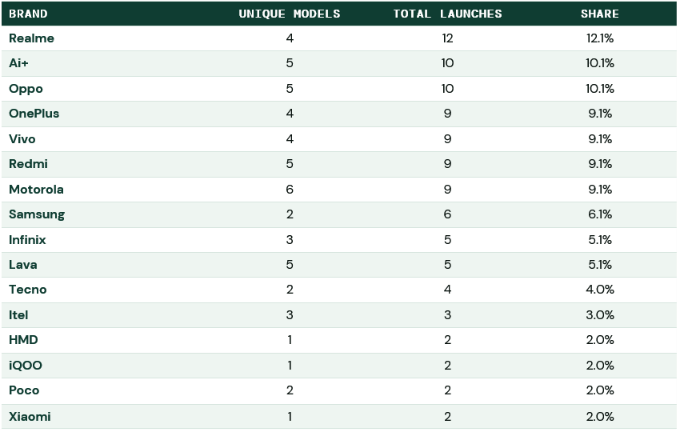
Realme led total launch volume (12) despite only 4 unique models, the highest variant-per-model ratio of any major brand. Motorola had the most unique models (6) but a lower variants-per-model rate, suggesting a broader-but-shallower lineup strategy.
1.5 Q2 Comparison: 2024 · 2025 · 2026
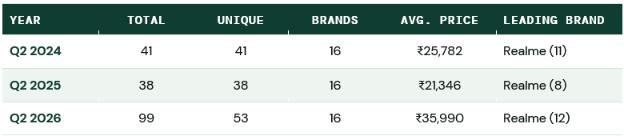
Launch volume roughly doubled year-on-year in 2026 (38 → 99) while unique models grew far more modestly (38 → 53); the jump is driven mainly by variant fan-out, not a proportional rise in new designs. 2024 and 2025 show almost no variant duplication at all, making variant-heavy launching a distinctly 2026 pattern.
Average operating price dipped from ₹25,782 (2024) to ₹21,346 (2025) before rising sharply to ₹35,990 in 2026 (+69% vs. 2025), reflecting a significant shift towards higher-priced launches after two budget-focused years.
Brand count held steady at 16 across all three years, but Realme has been the consistent Q2 volume leader every year, with Motorola and Vivo also recurring in the top ranks.
1.6 Other Key Aspects
Connectivity — 87.9% of Q2 launches were 5G-capable, effectively the market default.
Chipsets — MediaTek powered 51.5% of launches, ahead of Qualcomm (28.3%) and Unisoc (20.2%).
Displays — 51.5% used AMOLED/OLED-family panels; 96.0% offered 120Hz+ refresh rates — high refresh is now standard even in budget tiers.
Battery & charging — 81.8% shipped with 6,000 mAh+ batteries (avg. 6,614 mAh); only 27.3% supported 80W+ fast charging.
Make in India — 99% of launches were locally manufactured.
Lagging features — NFC adoption stood at 43.4% and eSIM at just 12.1% — both remain optional rather than standard, even in premium models.
Spec leaders — Vivo T5 Pro carried the largest battery (9,020 mAh); iQOO 15 Apex Edition led charging speed (100W); Vivo V70 FE reached a 200MP main camera; Itel A100 C New hit a 180Hz refresh rate — flagship-grade specs trickling into budget-adjacent models.
32 of the 38 Q2 entries are distinct models; 6 models (Lenovo Yoga Slim 7i Ultra Aura Edition, Lenovo IdeaPad Slim 3 Gen 11 AI, Asus ROG Zephyrus G16, and three Asus Chromebook lines) launched in two configurations each. Laptop variant depth is far shallower than smartphones — most models launch as a single SKU.
2.2 Month-wise Launch Trend
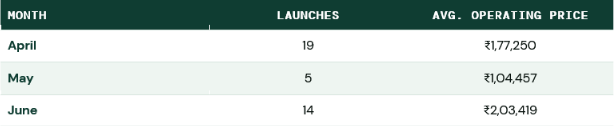
June carried the smallest launch count outside April but the highest average price (+94.7% vs. May), driven by a run of premium gaming and creator laptops.
2.3 Segment-wise Launches
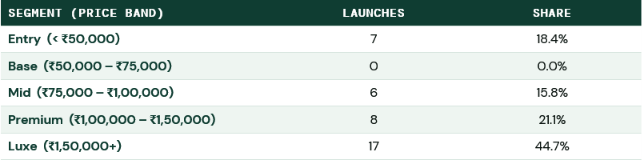
The Laptops tracker has no dedicated Segments sheet, so this report uses the price bands already applied in the tracker’s own Q2 Analysis tab, for consistency
Nearly half of Q2 launches (44.7%) sat above ₹1.5 lakh. Notably, zero launches fell in the ₹50,000–₹75,000 band — a visible whitespace in the Q2 portfolio worth flagging for competitive / positioning purposes.
2.4 Brand-wise Bifurcation
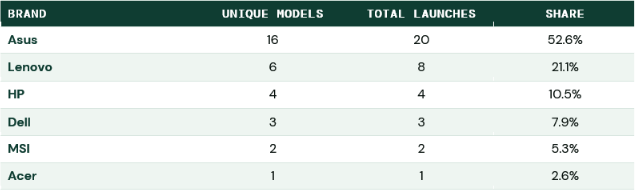
Asus alone accounted for over half of all Q2 launches (52.6%), the highest single-brand concentration of any category in this report.
2.5 Q2 Comparison: 2024 · 2025 · 2026
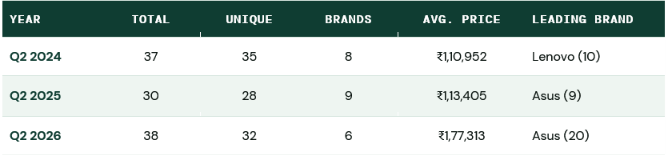
The number of active brands narrowed from 8–9 (2024–25) to just 6 in 2026, even as total launches held roughly flat (~30–38 per Q2) — consolidation, not growth, defines the recent trend.
Asus’s Q2 share ballooned from 9 launches in 2025 to 20 in 2026 (from ~30% to 52.6% of the quarter) — the sharpest single-brand concentration shift of any category tracked.
Average price has risen every year (₹1,10,952 → ₹1,13,405 → ₹1,77,313), with the 2025→2026 jump (+56.4%) far steeper than 2024→2025 (+2.2%) — Q2 2026 leaned much harder into premium/gaming launches.
2.6 Other Key Aspects
Processors — Intel powered 60.5% of launches, ahead of Qualcomm (18.4%), MediaTek (15.8%) and AMD (5.3%) — Arm-based Windows/Chromebook platforms now have a real foothold.
Operating systems — Windows 11 led with 81.6%; Chrome OS held 15.8%.
AI readiness — 78.9% of launches were Copilot+ certified.
Displays — 60.5% used an OLED-family panel; touch capability was roughly split (39.5% yes, 39.5% no, 21.1% optional).
Make in India — 63.2% of launches were locally manufactured — the lowest local-manufacturing share of the four categories.
Premium bellwethers — Asus ROG Zephyrus Duo 16 (₹6,99,990) and MSI Raider 18 Max HX (₹5,89,990) topped Q2 pricing, both gaming-class devices.
113 Q2 rows resolve to 63 unique model series once screen-size variants of the same series are grouped — smart TVs are typically launched as a single design sold across 2–5 screen sizes, and each size is logged as its own entry. This makes ‘launches’ and ‘models’ diverge more here than in any other category.
TCL’s P8L and C7L series, Hisense’s U7SE series, and Haier’s HQLED series each spanned 5 screen-size variants — the heaviest single-series fan-out in Q2.
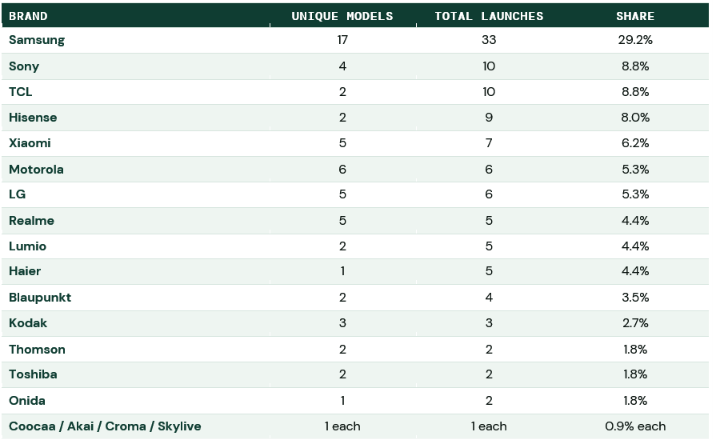
Samsung took a different approach: 17 unique series across 33 launches (~1.9 sizes per series) — a wider range of distinct designs rather than deep size fan-out of a few series.
3.2 Month-wise Launch Trend
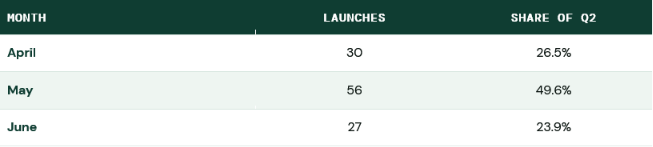
May was the standout month, nearly double April or June, likely tied to summer-season and sale-cycle TV pushes.
3.3 Segment-wise Launches
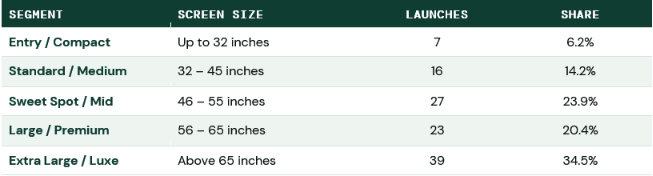
One entry had no recorded screen size and is excluded above. Extra Large / Luxe (>65″) was the single biggest segment by launch count (34.5%), a strong expensive signal, consistent with the high average price.
3.4 Brand-wise Bifurcation
Samsung’s 29.2% share is nearly triple its closest competitors (Sony and TCL, tied at 8.8%), the most concentrated single-brand lead of any category in this report.
3.5 Q2 Comparison: 2024 · 2025 · 2026
2025 was a smaller, more concentrated Q2 — fewer unique models (39, down from 88 in 2024) but a much higher average price (₹1,88,755, +86.7% vs. 2024), brands launched less broadly but skewed premium.
2026 rebounded to the highest launch volume of the three years with brand count returning to 19, while average prices moderated from the 2025 peak but remained well above 2024, indicating that launches continued to favour higher price bands.
Samsung has posted an almost identical launch count in Q2 every year (33, 31, 33), the most stable single-brand pattern in the whole three-year comparison, while the field around it shifted considerably (TCL and Hisense entering the top ranks by 2026).
3.6 Other Key Aspects
Panel technology — QLED led with 38.1% share, followed by LED (16.8%), Mini LED (14.2%) and LCD (13.3%); true OLED-family panels remained rare (2.7%).
HDR & Dolby Vision — HDR was near-universal (98.2%), but Dolby Vision support was lower (56.6%) — HDR-in-general has become baseline, Dolby Vision specifically has not.
High refresh — 144Hz+ panels reached 33.6% of launches, reflecting a gaming/smooth-motion push even in TVs.
Smart TV platforms — Google TV led (50.4%), followed by Samsung’s Tizen/One UI (25.7%); webOS, Fire TV OS and VIDAA each held single-digit shares.
Make in India — 95.6% of Q2 launches were locally manufactured.
Spec / price extremes — Samsung’s Vision AI QN80H (100-inch) was the largest screen launched; Samsung’s Micro RGB RH95 was both the highest refresh-rate model (165Hz) and the most expensive (₹7,99,990); Realme’s 32-inch Techlife QLED (2026 edition) was the most affordable at ₹10,999.
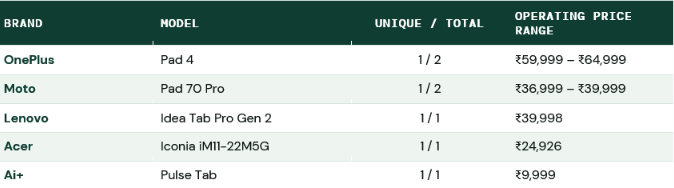
Q2 was a very thin quarter for tablets: only 7 entries, resolving to 5 unique models. OnePlus Pad 4 and Moto Pad 70 Pro each launched in two RAM/storage configurations; Ai+ Pulse Tab, Lenovo Idea Tab Pro Gen 2 and Acer Iconia iM11-22M5G launched as single-configuration models.
This is a seasonality effect, not a demand signal: the same tracker logged 18 tablet launches in March 2026 alone — over 2.5× the entire Q2 total. Tablet launch activity in India is heavily front-loaded into Q1 (likely tied to the pre-budget season and education/exam-cycle buying), making Q2 a structural lull rather than a slowdown.
4.2 Month-wise Launch Trend
4.3 Segment-wise Launches
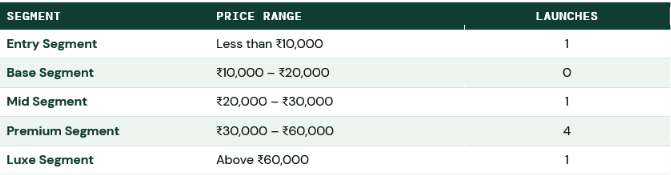
With only 7 entries, segment shares are directional, not statistically meaningful, but the Premium segment (₹30k–60k) clearly dominated Q2 activity.
4.4 Brand-wise Bifurcation
Every Q2 brand launched exactly one model line; OnePlus and Moto extended theirs into two RAM/storage tiers. No single brand dominated in count — the field was evenly split across five players.
4.5 Q2 Comparison: 2024 · 2025 · 2026
Q2 tablet launch volume has declined every year (13 → 11 → 7), alongside a shrinking brand roster (8 → 7 → 5) — a consistent three-year contraction of the category’s Q2 window, not a one-off dip.
Apple’s dominant 2024 Q2 (6 of 13 launches, 46%) has not repeated; 2025 and 2026 show a fragmented field with no single brand exceeding 3 launches — the category has moved from one leader to several small players.
Average price has swung significantly each year (₹51,237 → ₹31,544 → ₹39,560) with no consistent direction, which — combined with the very small sample sizes — makes pricing-trend claims for Q2 tablets weaker than for the other three categories.
4.6 Other Key Aspects
Cellular — Connectivity was a differentiator, not a default: only Ai+ Pulse Tab (4G) and Acer Iconia (5G) offered cellular; OnePlus, Lenovo and Moto models were Wi-Fi only.
Operating system: All 7 Q2 launches ran Android.
Screen sizes: Clustered around 13 inches for Premium-tier models (OnePlus, Lenovo, Moto) vs. ~11 inches for Entry/Mid-tier models (Ai+, Acer), a clean large-screen-for-premium pattern.
Caveat: Given the small sample, category-level conclusions for tablets should be paired with Q1 data before drawing firm trend lines.